This research analyzes liquidity activity exclusively in two-token pools involving Solana’ native token ($SOL) across decentralized exchanges (DEXs) like Raydium, Orca, and Meteora. By focusing on SOL pairs (e.g., SOL-USDC, SOL-JUP), we isolate trends specific to Solana’s core liquidity pools, excluding complex multi-token configurations (e.g., stablecoin tri-pools). The 30-day dataset (March 28 – April 27, 2024) reveals how different user segments—whales, large traders, and retail—interact with these pools, providing actionable insights for liquidity providers and protocol designers.
Executive Summary
This research explores Solana’s liquidity ecosystem over a 30-day period, focusing on three critical dimensions:
Thanks for reading valens’s Newsletter! Subscribe for free to receive new posts and support my work.
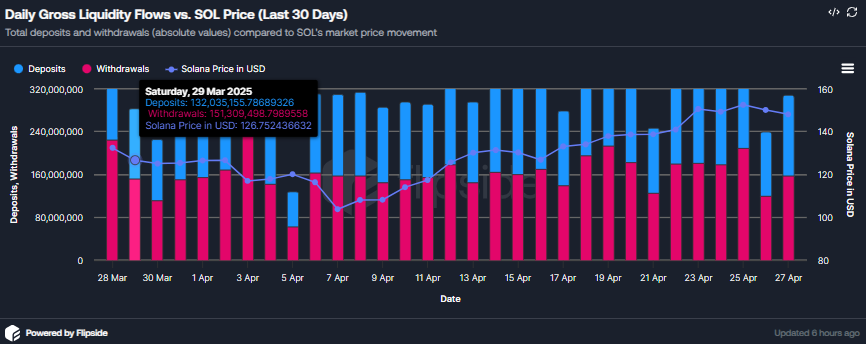
Liquidity flows: Daily capital movements between deposits and withdrawals in SOL pairs.
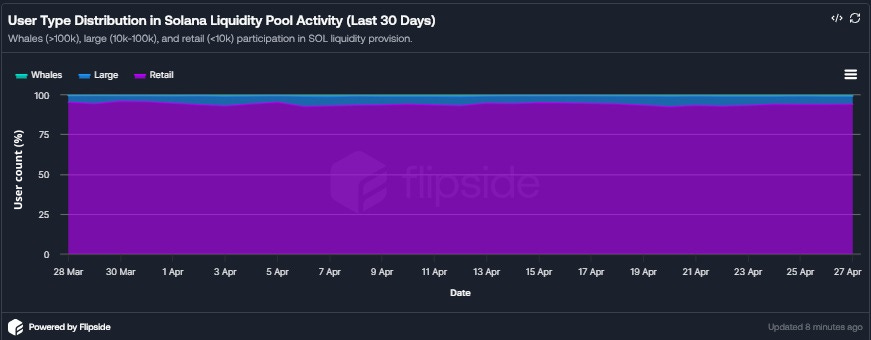
User segmentation: The disproportionate impact of whales versus retail traders.
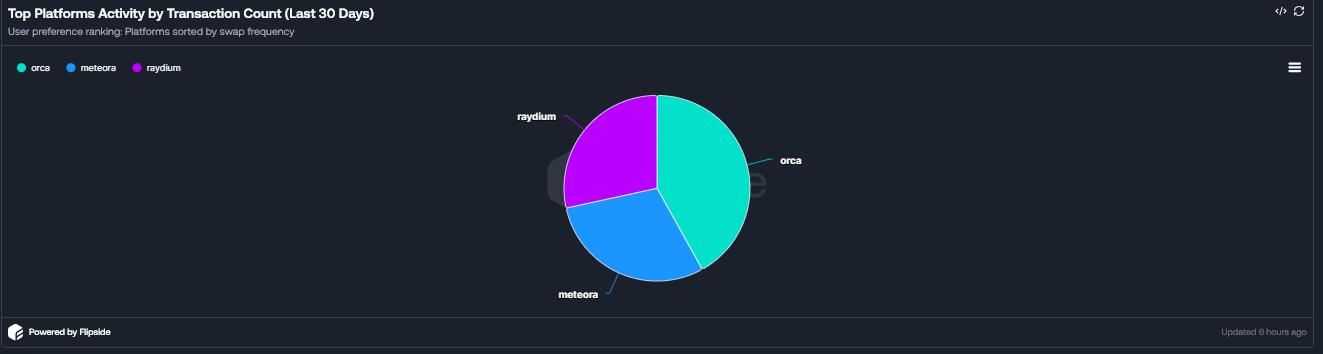
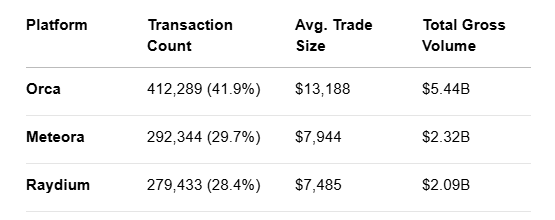
Platform competition: How decentralized exchanges (DEXs) like Orca, Raydium, and Meteora shape liquidity.
Key findings reveal that while retail users dominate participation (92-96%), whales (defined as >$100k transactions) drive outsized volume impact.
A notable divergence occurred on April 13, where retail inflows ($6.93M) counterbalanced whale outflows ($622K), masking underlying volatility risks.
This analysis underscores Solana’s reliance on retail engagement for network health while emphasizing the need to monitor whale activity for early risk detection.
Solana’s liquidity pools saw $18.48M in net inflows over 30 days, but volatility spiked during price swings:
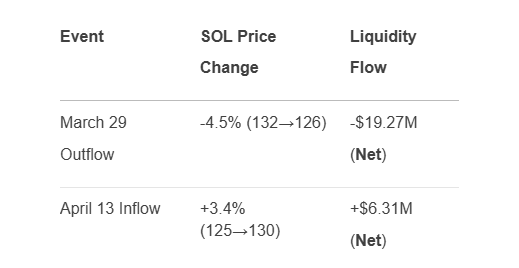
Largest Inflow: April 13 (+$6.31M) – Aligned with a 3.5% SOL price surge.
Largest Outflow: March 29 (-$19.27M) – Preceded a 4.5% price drop.
Key Insight: Consecutive outflow days (e.g., April 1–3) often signal impending price corrections, serving as a risk indicator for liquidity providers (LPs).
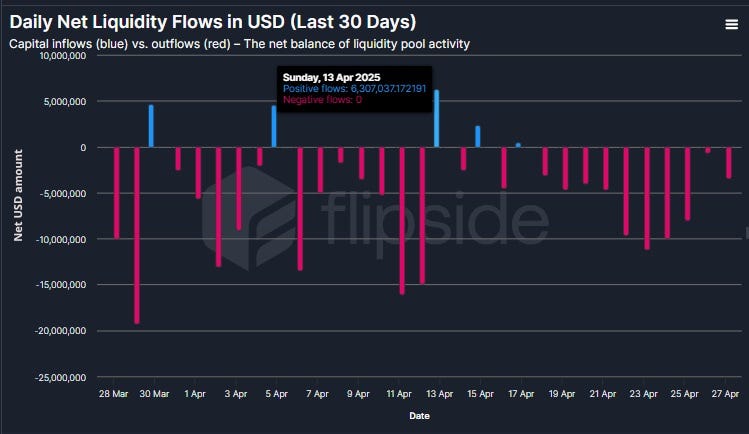
Source: Flipside Crypto by @suppvalen (aka, @chispas on Flipside)
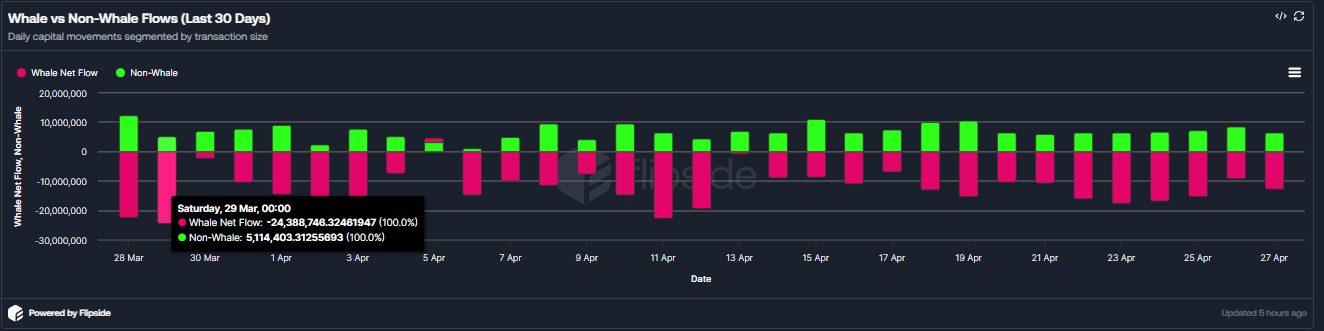
This chart splits daily net flows into these groups:
Whales (Red): Single transactions >$100k.
Non-Whale (Green): Retail (<10k) + Large (10k–$100k).
Key Events:
March 29: Largest net outflow (-$19.27M)
Whales: Withdrew $24.39M.
Non-whales: Deposited $5.11M.
Context: SOL dropped around 4.5% next day (from 132→126).
April 13: Retail Counteraction
Whales: Withdrew $622K.
Non-Whales: Deposited $6.93M.
Result: Net inflow of $6.31M despite whale skepticism.
Implication:
When whales and non-whale users move in opposite directions (e.g., March 29, April 13), it creates hidden liquidity risks.
Retail inflows can temporarily mask whale-driven outflows, but prolonged divergence often leads to volatility.
Deep Dive: March 29 Liquidity Crisis
What Happened?
Pre-Outflow: SOL price peaked at $132 on March 28.
Whale Signal: $24.39M withdrawn in a single day.
Retail Response: Small deposits ($5.11M) failed to offset exits.
Aftermath: Net outflow of $19.27M, preceding a 4.5% price drop.
Why It Matters:
Whale withdrawals often precede price drops, serving as an early warning system.
Retail traders, while numerically dominant, lack the capital to counter large-scale whale exits.
Future Research Directions
While this study isolates SOL two-token pools, future work could extend to multi-asset LPs, cross-chain bridged liquidity, and derivatives markets to capture a fuller picture of Solana’s capital flows.
Conclusion
Solana’s liquidity ecosystem thrives on a delicate balance: retail users provide stability, whales drive volume, and diverse platforms cater to niche needs. However, April’s data highlights lurking risks—when whales and retail diverge, hidden volatility often follows.
This research, powered by Flipside Crypto, underscores the value of on-chain analytics in decoding blockchain economies.
Thanks for reading valens’s Newsletter! Subscribe for free to receive new posts and support my work.
